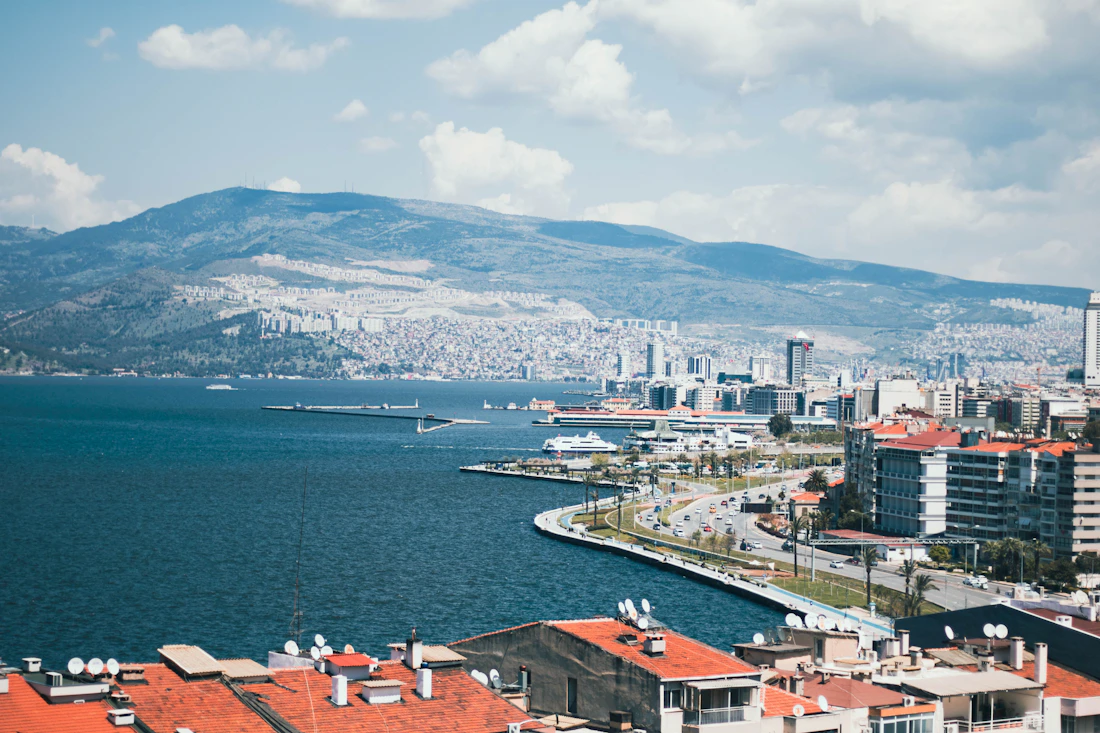
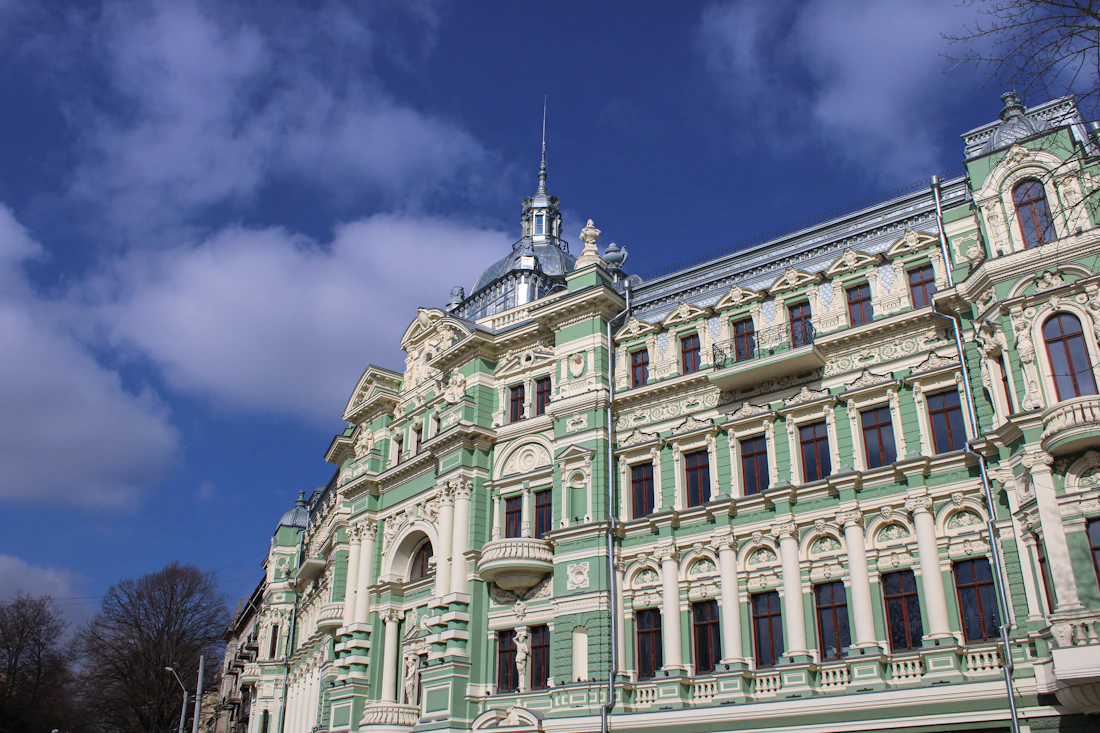
Most foreign buyers looking at Izmir run the comparison in their head. They remember what a flat costs back home, they have heard that Turkey is cheap, and they build their expectations on that. Halfway through the conversation the actual numbers land on the table and the picture usually turns out to be different.
So I sat down and worked it out. Below is a comparison of Izmir and Odessa using verified figures as of August 2026: what a square metre costs, what the same budget buys in each city, where each market is heading, and the legal limits a foreign buyer should know before putting money down. Every source is listed at the end with its date.
Why these two cities
The pairing is not arbitrary. Odessa and Izmir are structurally similar: large port cities on the sea, with a historic core, a holiday belt along the coast and strong domestic rental demand. Neither is a capital, yet both are among the most significant housing markets in their country.
There is a practical reason too. According to TÜİK, Ukrainian citizens ranked second among foreign buyers of Turkish property in June 2026, with 170 units in a single month. That is not a handful of transactions, it is a steady flow.
Price per square metre
I start here because every expectation is built around this one number.
| Metric | Izmir | Odessa |
|---|---|---|
| Average price per m² | ₺53,974 (≈ $1,136) | ≈ $1,246 |
| Average price per property | ₺6,476,880 (≈ $136,300) | ≈ $70,600 |
| Average size on the market | ≈ 120 m² | ≈ 57 m² |
| Annual change | +21% nominal, roughly -8% in real terms | 6% to 10% growth |
The first thing that stands out: the average square metre in Odessa costs roughly 10 percent more than the Izmir average. That contradicts the common assumption that the Turkish market is cheaper by default.
What the same budget buys
Take $70,000, roughly the average flat price in Odessa, and see what it buys in each city.
In Odessa that is an average property on the market, around 57 square metres. In Izmir, at the city average, the same budget corresponds to roughly 62 square metres. The difference is about five square metres, in the region of 10 percent.
That is the honest answer, and it is more modest than the marketing copy promises. There is no doubling of floor area here. The real difference appears at district level, not at city level, and that is the next section.
Where Izmir costs more than Odessa
The city average hides the spread. In Odessa the district range runs from roughly $603 to $1,700 per square metre. Izmir's coastal districts sit clearly above that ceiling:
| Izmir district | Price per m² | In dollars |
|---|---|---|
| Çeşme | ₺139,753 | ≈ $2,941 |
| Urla | ₺112,356 | ≈ $2,364 |
| Güzelbahçe | ₺105,082 | ≈ $2,211 |
| Narlıdere | ₺85,791 | ≈ $1,805 |
| Foça | ₺80,589 | ≈ $1,696 |
All five sit above the most expensive segment of the Odessa market. A buyer who heads straight for the Izmir coastline is paying a premium, not saving money.
The reverse is equally true. If the city average is around $1,136 while the districts listed above start at $1,696, then a substantial part of Izmir trades well below the average. That is where a budget works hardest, and those districts rarely appear in promotional listings.
Direction matters more than level
The price level describes today. The direction describes next year, and for an investor the second one decides more.
Here the two markets move in opposite directions. Housing in Izmir gained 21 percent in lira terms over the past twelve months. But annual inflation in Turkey was 31.75 percent in July 2026. In real terms that means housing lost roughly 8 percent of its value. The nominal gain is there, the purchasing power behind the investment fell.
Over the same period the Odessa market is rising by 6 to 10 percent in dollar terms.
Rental yield and payback
If the aim is income rather than resale, the number to look at is the payback period.
In the second quarter of 2026 the payback period for housing in Izmir came in at 16.5 years. For comparison, in the second quarter of 2022 it reached 26.2 years. Payback shortened by almost a decade in four years, because rents rose faster than property prices.
This is a city average and cannot be applied directly to a single property. In districts near universities and business centres rental demand is steadier and the period is usually shorter. In the holiday districts the picture is different: rents are high in summer, demand is close to zero in winter, and annual yield ends up lower than the July figures suggest.
The legal side for foreign buyers
Ukrainian citizens buy property in Turkey without any special permit, and the TÜİK statistics confirm it. The general limits in article 35 of the Land Registry Law apply to all foreign nationals, however:
Total area limit. A foreign individual may own no more than 30 hectares of property across the whole country.
District limit. Foreign nationals cannot own more than 10 percent of the surface area of any one district. If that threshold has already been reached where you are buying, the transaction will not go through regardless of your personal allowance.
Military and security zones. Acquisition here is entirely prohibited under Law no. 2565, with no exceptions. The boundaries are set by the Ministry of National Defence and updated regularly. This check is done before the deposit, not after.
I single out the last point because it is the only one that cannot be fixed afterwards. The area limit affects almost nobody in practice, the district percentage is checked at the land registry, but the military zone status must be confirmed before any money moves.
Which city suits whom
I do not think one city is objectively better than the other, and I am not going to pretend the numbers all point one way. They point in different directions.
Izmir comes out ahead if you want more floor area for the same money, if your horizon is five years or longer, and if you value room to negotiate in a market that currently does not favour the seller. It comes out behind if you are counting on rapid appreciation, because in real terms the market is falling right now.
Odessa comes out ahead on momentum and on unit size, if you want a smaller flat and would rather not take on the running costs of 120 square metres.
The general rule I repeat to everyone: a city average is for orientation, the decision is made on current comparable listings in the same neighbourhood, the same building type and the same age. The difference between two adjacent streets is often larger than the difference between two cities.
If you are considering a specific property and want it discussed in numbers rather than promises, write to me. I will tell you what argues for the deal and what argues against it.
Frequently Asked Questions
Is the square metre cheaper in Izmir or in Odessa?
What does a $70,000 budget buy in Izmir?
Are property prices in Izmir rising or falling?
Izmir prices and annual change: Emlakjet / Endeksa, July 2026.
Odessa prices: DIM.RIA, 8 August 2026, based on 30,975 active listings; district range additionally from RealtyBestUA.
Conversion rate: 1 USD = ₺47.5229, Central Bank of Turkey, bulletin 2026/146 of 7 August 2026.
Annual inflation 31.75%: TÜİK, July 2026 CPI.
Payback period 16.5 years: Q2 2026 index data.
Sales to foreign nationals, June 2026: TÜİK.
Legal limits: Land Registry Law no. 2644 article 35 and Law no. 2565 on Military Forbidden Zones and Security Zones.